
Key Takeaways
- To achieve its strategic goals, UMBC realized it needed to become a more data-driven institution by deploying more sophisticated tools and procedures to help staff find and analyze data in a timely way.
- Specifically, the university needed ways that users could develop accurate and easily configurable reports to support operational management and strategic analysis, which a data warehouse made possible.
- Successful implementation of the data warehouse required resolving campus-wide issues with buy-in, IT partnering with IR, governance, and cost.
The University of Maryland, Baltimore County (UMBC) knew that in order to achieve our strategic goals, such as increasing student success, we had to become a more data-driven institution with more sophisticated tools and processes for retrieving and interpreting information in a timely manner. Student success was a key driver of our efforts, and many pilot initiatives at the university were exploring how best to support it. Working with the Office of Undergraduate Education, Institutional Research did a thorough research study to help identify initiatives that were making a significant difference. We then focused our efforts on those initiatives that showed the greatest impact: expanding our named scholars programs, increasing First Year Seminars, and introducing programs to increase the student success rate in first-time math courses. This would not of been possible without the data warehouse and the work we had done with campus stakeholders to expand the data elements being captured. Through these efforts, we were able to integrate information that in the past had been hidden in data silos inside admissions, scholarships, and individual program offices. What follows is how we came to this point and where we will go next.
Needed: Accurate and Easily Created Queries
UMBC is a midsized, relatively young (<50 years old) university with strong teaching and research credentials. A decade ago we began implementing the enterprise resource management (ERP) program PeopleSoft, first Finance and HR and then, in 2009, PeopleSoft Student Administration (PSSA). A critical evaluation of what worked, and did not work, the first time around provided a strategic framework for how best to implement PSSA. There was consensus that, as part of that implementation, we needed to approach reporting differently and better support strategic analysis.
This need came to the fore when, in 2005, UMBC's senior leadership met with our sister institution for a demonstration of software designed by a local data warehousing company named iStrategy (now Blackboard Analytics). As they began showing screens of their data warehouse, UMBC President Freeman Hrabowski (a mathematician) began asking a series of questions: show me performance of students in this class by instructor, by placement test score, by high school attended, by grade in this prerequisite course, etc. Each question was answered in a minute or two and spurred further exploration and discussion. The engagement of Dr. Hrabowski and other leaders in this Q&A was evident — they were using their expertise in higher education to ask good questions and using data to dig deeper and deeper in understanding student performance.
Choosing a Solution
Though we investigated building a data warehouse in-house, we concluded it was better to have the benefit of a quick implementation and the vendor support from a purchased solution. We limited our search to companies that had ETL (extract, transform, load) tools available for PeopleSoft. This reduced our choices to two companies, PeopleSoft Enterprise Warehouse and iStrategy. PeopleSoft Enterprise Warehouse had licensing restrictions that limited what data could be loaded, and we wanted something that could be extended to load data outside the ERP. For that reason we chose iStrategy.
Facing Multiple Challenges
We knew that long-term success required that the data warehouse had to be accurate, timely, and widely used across campus. One of the first tools we developed was a report that allowed the president to track admission statistics each day and do a comparison with the prior year. . Dr. Hrabowski uses this feature daily and often brings up questions or ideas on student recruitment based on that data, which prompted others to view this report and use the tool. His support clearly speeded buy-in from the rest of the campus.
We also found that it was critical to build a true partnership between IT and institutional research (IR). Past efforts had shown how hard it was for two organizations to share the lead in a project that gave people system-level access rights to all the data. The leadership of both organizations worked hard to define service agreements and demonstrate to all staff that we expected this partnership to work.
Governance required that we first build a culture of data management and strengthen the team of data stewards we had on campus. Without building a campus culture that cared about data quality and accuracy, we knew we could not succeed. The VP of IT/CIO (author Jack Suess) and the Director of IR (author Michael Dillon) co-chair the data management council. The DMC is broken up into subcommittees that focus on data quality, requests for extending the data warehouse with new data elements, report creation, security, and training. Each subcommittee, led by a member of the DMC, involves the appropriate stakeholders for that activity.
Cost was probably the least of our problems. The iStrategy tool was very cost effective in that the license and yearly maintenance costs were reasonable, and the support we got from the vendor meant we had no outside implementation costs for consulting. In addition, our Microsoft license made the end-user business intelligence tools very affordable. As a result, we were able to implement the student warehouse for under $100,000.
A Novel Solution to the Challenges
UMBC did something novel. It installed iStrategy's PeopleSoft SA Solution (rebranded as Report Exchange, or REX) in 2006 using our legacy student information system (SIS) to load the data, three years before going live with PSSA. IT then did a quick (six months) conversion to have this work with our legacy SIS system, thereby populating REX with legacy data. This allowed the associate provost of Enrollment Management (EM; author Yvette Mozie-Ross) to get to data she normally had her IT manager get by querying the legacy system using SQL. This in turn freed up her IT manager to help oversee the "actual" conversion of SIS to PSSA and got an immediate buy-in for REX by many important stakeholders. That buy-in was reinforced by the CIO's declaration that REX was to be used whenever possible for reporting, thereby reducing the consultant cost related to report generation during the conversion to PSSA.
The decision to rely on REX was not just a cost-saving strategy; it was driven by a keen desire not to rely on writing reports from PSSA directly, since that invariably leads to silos of reports that don't talk to one another. Instead we focused on vendor support, along with in-house expertise, to make REX more robust and fulfill the reporting expectations of the campus.
Creating a campus-wide reporting solution requires a high degree of inter-department cooperation. For PSSA this means strengthening IT's ties with EM and IR. With EM the tie was relatively easy; REX provided tangible advantages from the start. For IR the issues were a bit harder to overcome because IR's state, federal, and other reporting required special fields and calculations not available in the delivered product. For example, Maryland's Higher Education Commission has detailed formulas for calculating FTE students. However, with ongoing assistance from IT, expert technical skills in IR, and the transparency of iStrategy's ETL procedures, we modified REX to put IR data directly into it. In turn, IR used what it learned from modifying REX to put 15 years of historical census data directly into REX, thereby allowing for longitudinal analysis of applications, admits, enrolls, student progression, financial aid, etc.
In expanding REX on campus we faced key decisions around management, user support, and governance. Figure 1 highlights the governance structure of data management at UMBC. Weekly management and priority setting is done by the Data Warehouse Team, chaired by the director of IR (Dillon). They analyze requests for new reports and manage changes to the data warehouse. This team works closely with the Setup Tables Team that manages the academic organization structure within the academic affairs unit and the Data Quality Team that creates nightly reports of potential dirty data.
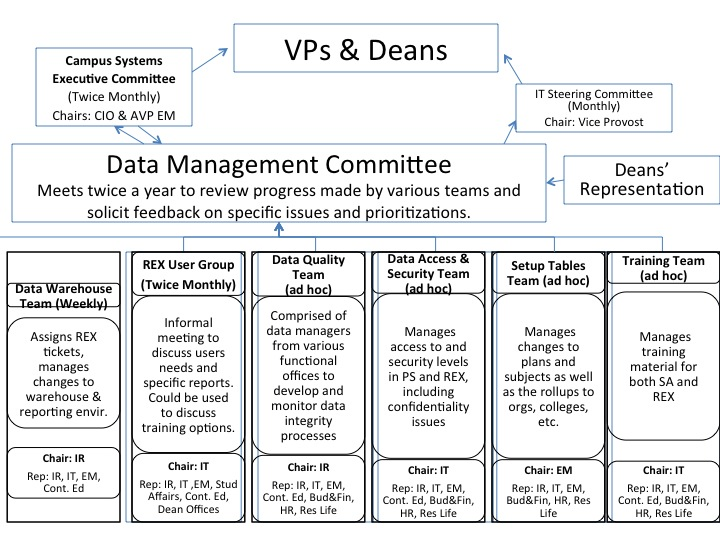
Figure 1. Data Management Committee
To support the campus community we have created a REX Users Group comprised of staff in the various offices on campus that are responsible for functional reporting. This group contains assistant registrars, staff in admissions and financial aid, staff in Continuing and Professional Studies, assistant deans in each college, and staff in the Office of Undergraduate Education. It provides a forum for any user to come and ask questions or share their experience. This allows staff in different colleges and departments to collaborate and share what they know, supported by IR and DoIT technical staff. Related to this group is a training team, which works with the REX Users Group and others to develop documentation and training materials for the campus. Staff in IR and IT provide regular face-to-face training sessions for staff and faculty wishing to get started.
A Campus Systems Executive Committee coordinates administrative initiatives and is co-chaired by the CIO (Suess) and associate provost for EM (Mozie-Ross). Policy changes are reviewed by the IT Steering Committee, chaired by the associate vice president for Academic Affairs (Antonio Moreira) and the CIO.
Looking Forward, the Future Is Bright
The decision we made in 2007 to use the data warehouse as our primary means of end-user reporting seems prescient. In the intervening five years we have built a true community of practice through the data warehouse. REX is used for official institutional reporting, reporting financial data, analysis of tuition revenue, classroom utilization, recruitment and admissions analysis, retention and student success, and analysis of campus support requests. REX has become essential to supporting the colleges and departments in accreditation and academic program reviews.
REX has proved essential to performing a number of analytic studies, such as looking at the effect on graduation of scholar programs that build strong scholarly communities versus simply providing merit aid for recruitment and yield purposes. The finding highlighted the benefits that resulted from scholar programs; as a result we are working to expand the scholar programs and have given them ways to use REX to monitor their progress. Another example is how our academic leadership looks at reports to monitor student performance in courses over time. This report — called the DFW report for tracking those students who earned a grade of D or F, or withdrew from the course — is used to determine if a course has fundamental problems and should be redesigned.
UMBC is actively expanding REX to include residential life, grants management, learning analytics, and financial aid information. We normally find we can add a new functional area in three to six months, depending on the complexity of the data and how much time the functional team can allocate to the project. Adding new modules is transparent to the campus community, and we can control access to each module individually. In this way, as we add new modules, members of the community see them show up in their log-in screen if they have access. The same tools are used for all modules, thus users find it easy to learn how to navigate new REX modules once they become accustomed to one. That said, we do control security for each REX module.
Today, senior administrators carry laptops to meetings and regularly go into REX to answer questions in real time. We have designed custom reports that include analytics and performance indicators that have helped us identify issues and make transformative changes that would not have been made without the data to understand why that change was important. We have indeed moved toward a data-driven culture of decision making using a campus-wide reporting solution.
For Additional Information
UMBC has pulled together a video presentation (22:15 minutes) of the authors (Michael Dillon, Yvette Mozie-Ross, and Jack Suess) and Kevin Joseph of OIR that provides a more detailed discussion on governance and campus outreach and gives examples of a few reports being used.
For more information on how UMBC is using analytics for institutional transformation, we encourage readers to listen to the podcast (35:29 minutes) developed as part of an article for EDUCAUSE Review, facilitated by John Fritz and featuring President Hrabowski, Provost Designate and Senior Vice President for Academic Affairs Philip Rous, and CIO Suess.
Jack Suess is Vice President for Information Technology and CIO, Michael Dillon is Director of Institutional Research, and Yvette Mozie-Ross is Associate Provost for Enrollment Management at the University of Maryland, Baltimore County.
© 2012 Jack Suess, Michael Dillon, and Yvette Mozie-Ross. The text of this EDUCAUSE Review Online article (September/October 2012) is licensed under the Creative Commons Attribution 3.0 license.