
Key Takeaways
- An initiative aimed at institutional growth further fuelled Philadelphia University's push toward more data-driven processes and led to the development of a campus-wide performance dashboard.
- Mining data that wasn't in electronic form was one challenge, but the larger issues related to data access and reliability, as well as time-intensive data-gathering efforts.
- The dashboard effort highlighted the importance of establishing user groups, gaining support within academic departments, and focusing on tangible benefits, such as increased resource utilization.
- Legacy practices and cultural barriers to change can have a significant impact on implementation and adoption.
In the summer of 2010, as part of a broader push toward data-driven processes by Philadelphia University's new leaders, our provost launched an effort to develop a multiyear plan focused on the intelligent growth and expansion of our academic programs and faculty. This initiative provided a significant tipping point for our long-term plan to explore our institution's operations by examining trends, patterns, and tendencies within the critical quantity of data that we'd amassed after nearly 10 years of using a Datatel enterprise resource planning (ERP) system.
Although confident that we had a sufficient accumulation of data to provide historical evidence of past patterns of behaviors at the university, we lacked the user-friendly tools and analysis environment to provide our leadership access to that data and thus the ability to analyze and forecast trends. Thus, in late 2010 we made a tactical move away from a proprietary ERP database (Unidata) to a more transportable database (SQL) to increase the set of software tools available to support our analytics planning and implementation effort. In parallel we were exploring dashboard solutions from various vendors. Generally, the solutions were limited, costly, and lacked the level of flexibility that we believed would be required to set the stage for broad-based adoption. Concurrent to our investigation, the Microsoft SharePoint solution and its built-in Reporting Services was maturing rapidly, and by early 2011 it was sophisticated enough to meet our needs, allowing for the creation/design of graphical data representations, granular drill-down, and user-specific access/restriction to data sources.
Context and Challenges
As a first step toward developing a plan for smart growth, our academic deans and directors were charged with gathering historical data regarding the growth of the academic programs and faculty in their respective schools. It quickly became clear that, while most of the recent data surrounding program growth, enrollment, and faculty loads existed, access was very paper-centric — little or none of this historic information existed in electronic form. Mining this information would be a challenge, but the overarching problem was rooted in access, reliability, and the amount of time required to have each academic office search for, gather, and summarize their own data.
Project Requirements
Given this context, we quickly realized that this initiative would require a great deal of time and support from the central information resources organization. We also realized that it was imperative that we build an information environment that would provide university leadership with timely and reliable access to institutional data on demand and through an easy-to-navigate portal.
Finally, we knew that the growth initiative would require enrollment, registration, course scheduling, course section frequency, and adjunct assignment pattern data, along with a great deal of other data that historically had not been made available to deans and program directors in any form.
Defining the Goals
To foster innovation, a critical and in-depth examination of program and faculty growth — fueled by extensive analysis of the cost of education at our institution — is paramount.
Of equal import is the notion of transparency and the necessity for all parts of the university to act from an informed position based on a central, reliable, and authoritative data source.
Reaching these goals would require that administration, faculty, and professional staff work more collaboratively, sharing information in real time. The historic static report environment would no longer suffice; our university's leadership needed executive dashboards focused on key performance indicators to support rapid and more effective decisions.
Building an Analytics Environment
Steve Spinelli, Jr., President of Philadelphia University, explains how the dashboard has empowered the Board of Trustees
Our proposal was to implement a campus-wide performance dashboard and analytics environment. This proposal has enjoyed the unwavering endorsement of the university's president, who provided executive support for the concept from the very start.
One of the most important first steps is to begin by assessing your institution's readiness for analytics, key performance indicators (KPIs), and dashboard tools (see table 1). Your expectations should be framed by which stage of readiness your institution falls into, with an eye toward evolving from your current stage to the next stage of readiness. Next, you should identify ways to leverage existing technologies.
| Success Factor | Stage 1: Analytically Impaired | Stage 2: Localized Analytics | Stage 3: Analytical Aspirations | Stage 4: Analytical Companies | Stage 5: Analytical Competitors |
|---|---|---|---|---|---|
| Data | Inconsistent; poor quality and organization; difficult to do substantial analytics; no groups with strong data orientation | Much data unusable, but in functional or process silos; senior executives don't discuss data management | Identifying key data domains and creating central data repositories | Integrated, accurate, common data in central warehouse; data still mainly an IT matter; little unique data | Relentless search for new data and metrics; organization separate from IT oversees information; data viewed as strategic asset |
| Enterprise | No enterprise perspective on data or analytics; poorly integrated systems | Islands of data, technology and expertise deliver local value | Process or business unit focus for analytics; infrastructures for analytics beginning to coalesce | Key data, technology, and analysts are managed from an enterprise perspective | Key analytical resources focused on enterprise priorities and differentiation |
| Leadership | Little awareness of or interest in analytics | Local leaders emerge but have little connection | Senior leaders recognizing importance of analytics and developing analytical capabilities | Senior leaders developing analytical plans and building analytical capabilities | Strong leader behaving analytically and showing passion for analytical competition |
| Targets | No targeting of opportunities | Multiple disconnected targets, typically not of strategic importance | Analytical efforts coalescing behind a small set of important targets | Analytics centered on a few key business domains with explicit and ambitious outcomes | Analytics integral to the company's distinctive capability and strategy |
| Analysts | Few skills; those that exist are attached to specific functions | Unconnected pockets of analysts; unmanaged mix of skills | Analysts recognized as key talent and focused on important business areas | Highly capable analysts explicitly recruited, developed, deployed, and engaged | World-class professional analysts; cultivation of analytical amateurs across the organization |
© Thomas H. Davenport, Harvard Business Review, 2010. All Rights Reserved.
One of our most important decisions was made nearly 10 years ago when we deployed the Datatel-integrated ERP built around a common, authoritative database. Our eventual move to SQL provided a nonproprietary database pathway to collaboration tools such as Microsoft SharePoint. Licenses for SQL and SharePoint were in place, and, as a result, we were able to build the analytics and data-mining framework on existing technology investments. Our dashboard was built around four existing solutions:
- Ellucian Colleague
- Microsoft SQL Server
- Microsoft SharePoint
- Microsoft SharePoint integrating with Microsoft Reporting Services
The dashboard solution we built is represented by the screenshots and the video capture of the navigation and drill-down detail. The tool is web-based and uses our existing authentication scheme. Reports and views can be exported to Excel, PDF, and other more common viewing/editing file types. The development process has been both inclusive and transparent, involving primarily the Administrative Computing team, along with Network and Systems, but most importantly, members of each department who will use and rely on the dashboard tool every day. Input from the departments and our own local Datatel users group has helped this project succeed quickly.
One challenge throughout has been the lack of additional staff devoted to our analytics effort. Our vision of the final stages of the project includes department-level skills, coupled with a high level of expertise within the Administrative Computing unit (hopefully a new position hire). Having a dedicated position will allow campus adoption to achieve a more accelerated pace and satisfy a greater number of departmental needs while allowing the tools to have even more significant impact on campus decision making and planning.
Lessons Learned
The past 18–24 months of effort on this initiative have provided us with a number of valuable lessons and insight into a project of this magnitude and scope. First, top-down support has been critical to gaining credibility and momentum. Second, extensive interaction with the campus users group has been key to building support and allies throughout the campus.
Establish a User's Group
Never underestimate the colossal change an analytics effort represents to the front-line departments and staff. Many departmental staff on our campus have been working with the same systems and tools for several years. Although establishing a user's group does not remove the resistance and cultural barriers, a user's group does serve as a consistent platform for all parties to address concerns and work through problems and issues. In our case, we could not have succeeded without an effective user's group.
Demonstrate the Tangible Benefits to Leadership
Jack Klett, Associate Dean of Graduate Studies for the College of Design, Engineering, and Commerce and former Director of Graduate Admissions, explains how the dashboard makes decision making easier
To institute the broad organizational change that creating a data-driven culture entails, it's essential that the project receive full support from the administration. We were fortunate to have that support, but it also helped that we were ready from an IT infrastructure perspective.
In addition, we recognized that it's very difficult to justify an investment in analytics simply based on faster and better decision making, which can be challenging to quantify. We therefore focused on what we thought would be the most tangible impact in the short term: better utilization of existing resources. We showed the labor consumed by the status quo approach of manual reporting and how that could be repurposed by automating reports. We also showed how analytics could help us make better decisions on our course offerings and resource utilization.
Figure 1 shows some example enrollment reports by student type, college, and enrollment type. Philadelphia University offers approximately 1,000 course sections per semester. Based on our analytics, we determined that a portion of those sections could be consolidated or modified without impacting educational outcomes. We expect that, by consolidating enrollments, we could save space and human resources. Data that identifies resource savings provides concrete justification for investing in analytics.

Figure 1. Enrollment reports
This video shows how the Smart Growth dashboard drills down into underutilized or under-enrolled course sections.
Lloyd Russow, Associate Provost, talks about the value of drilling down into the data
Gain Momentum by Winning over Campus Departments
It's critical to meet, engage, and communicate with your constituents to gain support and increase momentum for your project. Begin by presenting a group or department with a mock-up of what a dashboard could look like. Avoid dictating or forcing a solution. Invite departmental staff to explain how they would envision the new business process and ask them to outline the workflow that will drive the resulting dashboard or report. For analytics to succeed, the individuals using the tools must own their dashboard and their data, and understand that data control remains in their hands.
It's also important to understand each group of stakeholders. For top management, the primary drivers are return on investment and transparency. At the department-manager level, the ability to track the group's progress is key. At the staff level, automated reporting and efficiency will sell analytics. In our case, we clearly communicate the parameters related to dashboard access, emphasizing both that the information will be available at all times and that using it eliminates the need to spend many hours each week creating reports.
Early Achievements
As the following audio describes and figure 2 and table 2 show, the use of the dashboard has dramatically changed basic reporting practices at Philadelphia University.
Greg Potts, Director of Undergraduate Admissions, explains how much time is saved using the dashboard
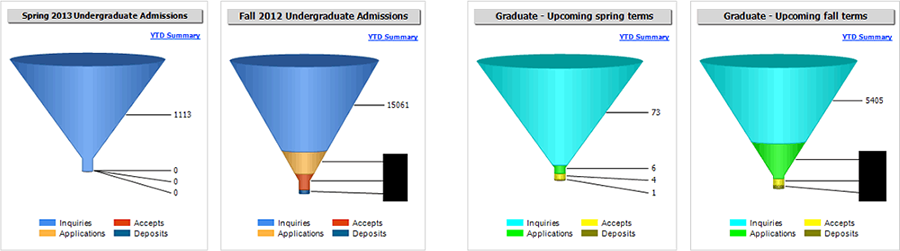
Figure 2. Admissions information
Table 2. Report Handling before and after Dashboard Implementation
| Report and Historic Approach | Replaced by |
|---|---|
| Weekly undergraduate: Excel/PDF; static | Dashboard: updated nightly |
| Weekly graduate: Excel/PDF; static | Dashboard: updated nightly |
| Weekly capital campaign: Excel/PDF; static | Dashboard: updated nightly |
| NCAA compliance: Excel; static | Extracted report: updated nightly |
| Study abroad office: Excel/PDF; static | Extracted report: updated nightly |
| Deans periodic report: Excel/PDF; static | Dashboard: updated nightly |
| Section scheduling: reactive and based on legacy practice | Proactive, based on projected demand |
| Adjunct hiring: reactive and based on legacy practice | Proactive, based on projected demand |
At the departmental level, one early and important success for our team was in the athletics department. The associate athletic director previously relied on manual and labor-intensive data searches and spreadsheets to fulfill compliance requirements. The dashboard now provides access to the required compliance information in an easy-to-use graphical format via the web (see figure 3).
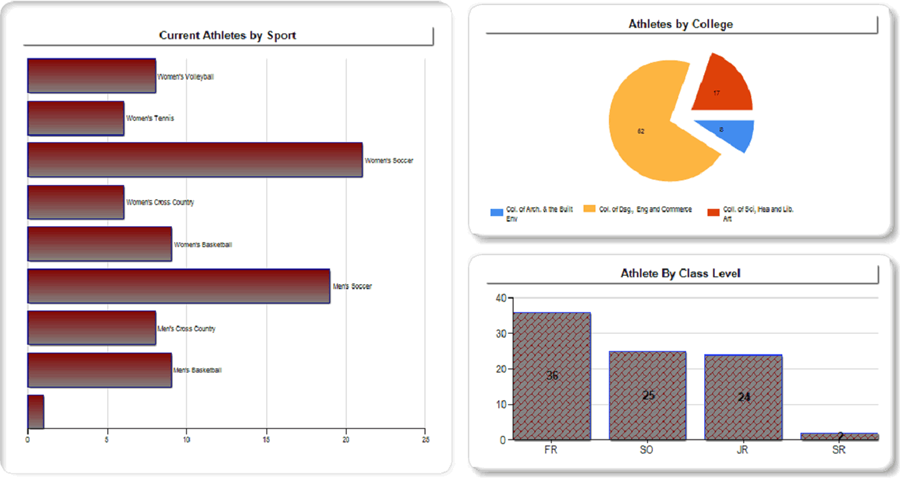
Figure 3. Data on athletes
Stephanie Spada, Assistant Director of Athletics, describes how the dashboard made meeting a specific NCAA requirement fast and easy
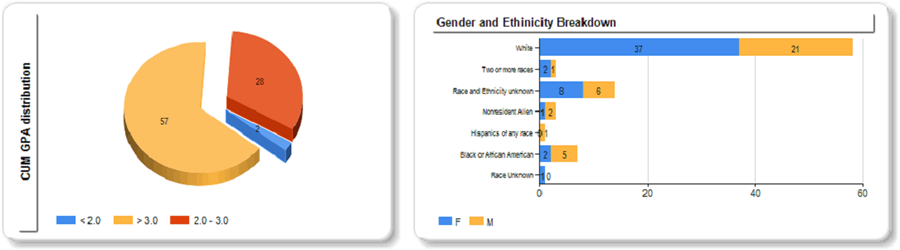
Figure 4. Cumulative GPA and gender/ethnicity breakdown of students
Next Steps
We are in the early stages of constructing a framework for exploring learning analytics based on a very broad set of variables that impact student success, including academic activities, social involvement, health and wellness, and interactions with an array of academic resources. By taking these ambitious steps, we have successfully developed the support tools and a culture of data-driven decision-making with the goal of transforming Philadelphia University into a high-performing organization.
© 2012 Jeffrey Cepull, Rashmi Radhakrishnan, and D. R. Widder. The text of this EDUCAUSE Review Online article (July 2012) is licensed under the Creative Commons Attribution-Noncommercial-No Derivative Works 3.0 license.